
Plotting Data#
Python allows for the plotting of data in a very clean way. You can make nice simple graphs, and you can make complex graphs aswell depending on your needs.
The fastest way to do this is with the matplotlib library
import matplotlib.pyplot as plt
import numpy as np

#setup your independent and dependent variables.  Lists or numpy arrays are reccomended.
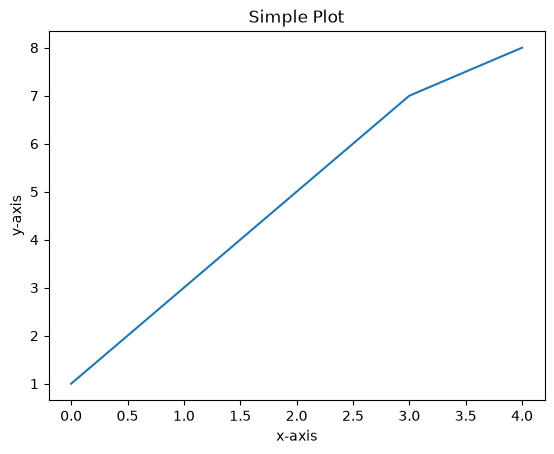
x = [0,1,2,3,4]
y = [1,3,5,7,8]

#plot using the plot function
plt.plot(x, y)

#Add your labels!
plt.title("Simple Plot")
plt.xlabel("x-axis")
plt.ylabel("y-axis")

#Don't forget to show your data
plt.show()
import matplotlib.pyplot as plt
import numpy as np

#numpy can quicken the axis generation if you like
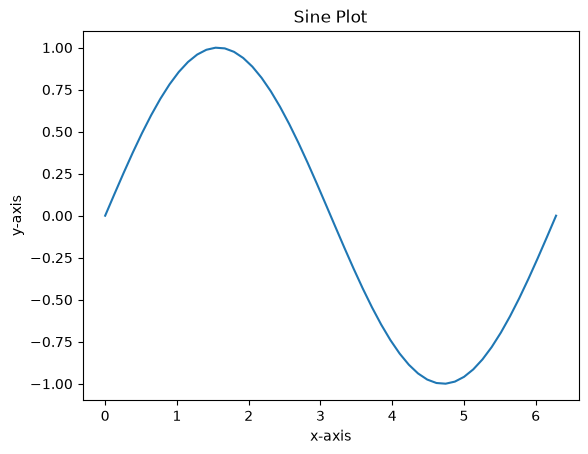
x = np.linspace(0,2*np.pi,50) #linspace(start, stop, count) will make a np array of numbers from start to stop with count values inside the list evenly distributed
y = np.sin(x)

#plot using the plot function
plt.plot(x, y)

#Add your labels!
plt.title("Sine Plot")
plt.xlabel("x-axis")
plt.ylabel("y-axis")

#Don't forget to show your data
plt.show()
#Sandbox Area