
Moving an image to matplotlib#
import matplotlib.pyplot as plt
# Prompt user for image name
image_name = input('Enter image name (with extension): ')
#base image: "images/spiderPete.jpg"
# Read the image using matplotlib
image = plt.imread(image_name)
# Display the image
plt.figure()
plt.imshow(image)
plt.title('Spider Pete')
plt.xlabel('It is a spider') # Appropriate label
plt.ylabel('It is Pete') # Appropriate label if needed
# Show the plot
plt.show()
---------------------------------------------------------------------------
StdinNotImplementedError Traceback (most recent call last)
Cell In[1], line 4
1 import matplotlib.pyplot as plt
2
3 # Prompt user for image name
----> 4 image_name = input('Enter image name (with extension): ')
5 #base image: "images/spiderPete.jpg"
6 # Read the image using matplotlib
7 image = plt.imread(image_name)
File ~/.local/lib/python3.12/site-packages/ipykernel/kernelbase.py:1402, in Kernel.raw_input(self, prompt)
1400 if not self._allow_stdin:
1401 msg = "raw_input was called, but this frontend does not support input requests."
-> 1402 raise StdinNotImplementedError(msg)
1403 return self._input_request(
1404 str(prompt),
1405 self._get_shell_context_var(self._shell_parent_ident),
1406 self.get_parent("shell"),
1407 password=False,
1408 )
StdinNotImplementedError: raw_input was called, but this frontend does not support input requests.
Modifying images in Matplotlib
import matplotlib.pyplot as plt
import numpy as np
image1 = plt.imread('images/spiderPete.jpg')
image2 = plt.imread('images/spiderPete.jpg')
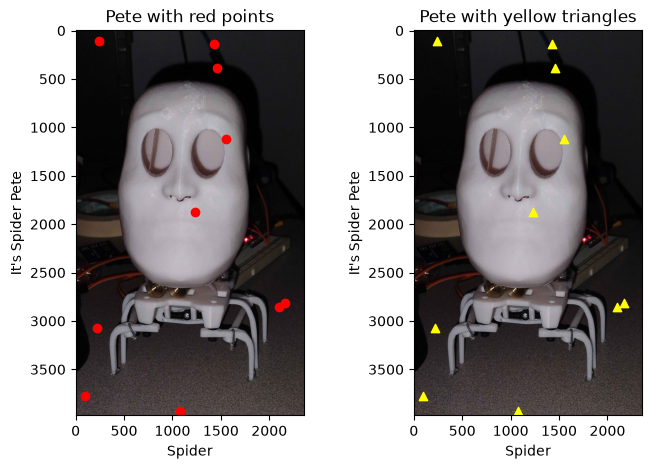
x_points = np.random.randint(0, image1.shape[1], 10) # x-coordinates
y_points = np.random.randint(0, image1.shape[0], 10) # y-coordinates
fig, axs = plt.subplots(1, 2, figsize=(8, 5))
axs[0].imshow(image1)
axs[1].imshow(image2)
axs[0].scatter(x_points, y_points, c='red') # red points
axs[1].scatter(x_points, y_points, c='yellow', marker = '^') # yellow Triangles
axs[0].set_title('Pete with red points')
axs[1].set_title('Pete with yellow triangles')
axs[0].set_xlabel('Spider')
axs[1].set_xlabel('Spider')
axs[0].set_ylabel("It's Spider Pete")
axs[1].set_ylabel("It's Spider Pete")
#plt.tight_layout()
plt.savefig("spiderPetePlot.png")
plt.show()
#Sandbox Area